Life Cycle Assessment Of Asphalt Vs. Alternatives: Breaking Down the Impact
Published on: March 9, 2026 | Last Updated: April 14, 2025
Written By: George Voss
Life cycle assessment (LCA) measures environmental impact, material sustainability, and cost-effectiveness across asphalt and alternative materials like concrete, recycled plastics, and bio-based binders. Asphalt leads with a 95% recyclability rate using reclaimed asphalt pavement (RAP), while alternatives like concrete emit 50% more CO₂ during production. Initial asphalt costs average $2–$5 per square foot, 25% lower than concrete. Maintenance cycles (10–15 years for asphalt vs. 20–40 for concrete) and water pollution risks from bitumen require careful evaluation.
This article examines six phases of asphalt’s life cycle, from mining aggregates like limestone to recycling aged pavements. You’ll explore four LCA methods, including carbon footprint analysis (1.6–2.2 tons CO₂ per ton of hot mix asphalt) and energy use comparisons. Data-driven comparisons cover recycled plastics’ microplastic risks, lignin bio-binders’ 30% emission cuts, and wood-plastic composites’ load limitations. Tools like asphalt calculators optimize material estimates, reducing waste by up to 12% in road projects.
Contents
- Understanding the Life Cycle Of Asphalt Pavement
- Four Types Of Life Cycle Assessment (LCA)
- Life Cycle Assessment for Asphalt Materials
- Key Factors in Asphalt Life Cycle Analysis
- Comparing Asphalt With Alternative Road Materials
- Environmental Impact Metrics for Asphalt
- Four Critical Considerations in Asphalt LCA
- Role Of Asphalt Calculator in LCA Planning
- FAQ: Life Cycle Assessment Of Asphalt Vs Alternative Materials
- Closing Thoughts
- Useful References for You:
Understanding the Life Cycle Of Asphalt Pavement
Asphalt’s environmental footprint spans six distinct phases. Each stage impacts resource use, emissions, and long-term performance compared to materials like concrete or composites.
Phases Of Asphalt Pavement Life Cycle
From quarry to roadway, asphalt production follows a closed-loop system. Tracking these steps reveals opportunities to cut emissions and boost recyclability.
1. Material Extraction for Asphalt Production
Aggregates (crushed stone, sand) make up 90-95% of asphalt by weight. Mining granite or limestone requires 3-5 kWh/ton of energy. Local sourcing slashes transport emissions—a key factor in life cycle assessment asphalt comparisons.
2. Processing Aggregates and Binders
Aggregates get dried at 150-175°C before mixing. Bitumen, a petroleum byproduct, acts as the binder. Modern plants use warm-mix additives to lower temps by 28-40°C, cutting fuel use 15-20%.
3. Asphalt Mix Design and Construction
Superpave specifications tailor mixes to traffic loads and climates. A 12.5mm surface course uses 5-7% bitumen. Proper compaction (92-96% density) prevents premature cracking, extending service life beyond 15 years.
4. Pavement Use and Traffic Load Management
Heavy trucks cause 95% of pavement wear. A 10cm asphalt layer handles 20M equivalent single-axle loads (ESALs). Regular inspections spot rutting early, delaying costly rebuilds.
5. Maintenance and Rehabilitation Strategies
Crack sealing costs $0.15-$0.30 per linear foot. Mill-and-fill operations restore surfaces while recycling 100% removed material. Proactive care reduces life cycle cost of asphalt by 30-50%.
6. End-of-Life Recycling or Disposal
95% of asphalt gets recycled into RAP (reclaimed asphalt pavement). Mixing 25% RAP cuts virgin binder needs 15%. Landfill disposal—rare under 5%—is less eco-friendly than alternatives like wood-plastic composites.
Key Components Influencing Asphalt Durability
Two elements dictate asphalt’s LCA competitiveness: aggregate strength and binder chemistry. Both determine how it stacks against alternative road surface materials.
Role of Aggregate Quality in Asphalt Performance
Los Angeles abrasion values below 35% ensure aggregates resist crushing. Poor-quality stone increases rutting risks by 200%, forcing more frequent rebuilds. High-polished stone value (PSV >55) maintains skid resistance longer.
Binder Types and Their Environmental Impact
PG 64-22 binders dominate temperate zones. Polymer-modified binders last 2x longer but add 12-18% to material costs. Bio-binders from lignin cut CO₂ 20%, though availability lags behind petroleum options.
With the pavement life cycle mapped, evaluating asphalt against alternatives requires dissecting four LCA methodologies. Next: how inventory analysis and impact metrics shape eco-friendly asphalt decisions.
Four Types Of Life Cycle Assessment (LCA)
Life cycle assessment splits into four distinct parts. Each part tracks how road materials affect surroundings from start to finish. This split allows builders to spot weak points and boost sustainability.
1. Life Cycle Inventory (LCI) for Asphalt
LCI lists all inputs and outputs in asphalt’s life. For a typical road, this includes 94% aggregates (crushed rock, sand) and 6% bitumen. It also tracks fossil fuels burned during mining, transport (up to 15% of total CO2), and plant operations. A ton of hot mix asphalt (HMA) needs 150-200 kWh of power. LCI tools like GaBi or SimaPro map these flows with GPS-level accuracy.
2. Life Cycle Impact Assessment (LCIA)
LCIA translates LCI data into tangible impacts. Methods like TRACI or ReCiPe rank factors such as global warming potential (GWP) or acid rain risk. Asphalt plants releasing 0.05 tons of CO2 per ton of mix score high on GWP scales. Warm mix asphalt (WMA), made at 30°C lower temps, cuts this by 20%. LCIA might show asphalt scoring 3.2 kg CO2eq/m² vs concrete’s 4.1 kg CO2eq/m².
3. Comparative LCA: Asphalt Vs Alternatives
Side-by-side LCAs pit asphalt against concrete, recycled plastics, or lignin-based pavements. Data shows asphalt roads last 15-20 years vs concrete’s 30-40 but need 35% less upfront CO2. Adding 30% RAP (recycled asphalt pavement) trims mining needs by a third. Plastic composites, while light, crack at -10°C and cost 50% more. Bio-binders from wood waste slash bitumen use but lack long-term load data.
4. Interpretation Of LCA Results
This phase turns numbers into action. If an LCA finds 60% of asphalt’s carbon comes from bitumen heating, plants might switch to solar thermal systems. Tools like BEES or PaLATE help weigh options: a road using 40% RAP could lower yearly costs by $12K/mile but need 10% thicker layers. Local factors matter—urban roads with heavy traffic favor high-RAP mixes, while rural routes might prioritize low-cost virgin materials.
Looking at carbon footprints next shows how asphalt stacks up against rivals in raw output.
Life Cycle Assessment for Asphalt Materials
Modern asphalt life cycle analysis quantifies environmental impacts from raw material extraction to end-of-life recycling. These studies reveal critical insights for comparing asphalt with concrete, composites, or bio-based alternatives.
Carbon Footprint Of Asphalt Production
Producing 1 ton of hot mix asphalt emits 25-35 kg CO₂ equivalent. Emissions stem from three primary sources: binder heating (40%), aggregate drying (35%), and transportation (25%). Modified binders like PG 76-22 can cut emissions by 18% compared to conventional PG 64-22 grades. Asphalt’s carbon footprint remains 20% lower than concrete per lane-mile when considering 40-year service life.
Energy Consumption in Asphalt Manufacturing
Traditional hot mix asphalt requires 1.2-1.6 million BTU per ton during production. Energy use breaks down as:
| Process Stage | Energy Share |
|---|---|
| Aggregate heating | 58% |
| Binder heating | 27% |
| Plant operations | 15% |
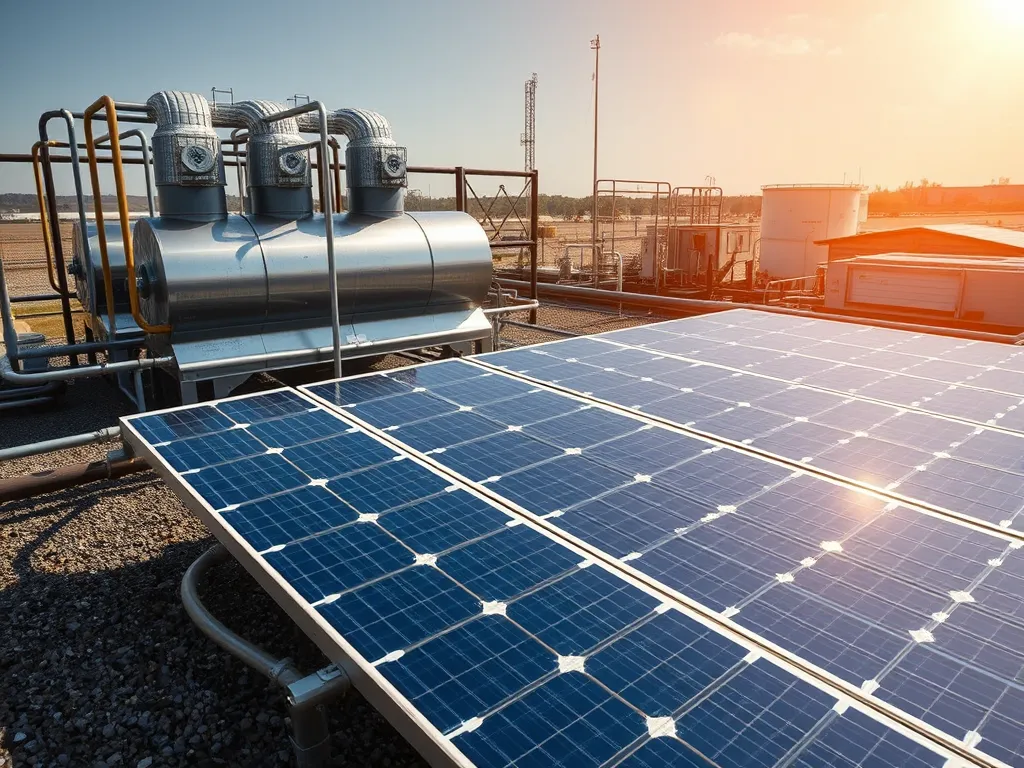
Warm mix asphalt technologies reduce temperatures by 50°F, slashing energy needs by 22-30%. Solar-powered asphalt plants now achieve 40% grid energy offset in pilot projects.
Recycled Asphalt Pavement (RAP) in LCA
Using 30% RAP in mixes decreases virgin binder demand by 20% and cuts GHG emissions by 1.5 kg CO₂e per ton. The Federal Highway Administration reports 99% recycling rates for asphalt millings – diverting 89 million tons annually from landfills. Life cycle studies show RAP incorporation lowers:
- Water pollution risk by 12%
- Non-renewable energy use by 16%
- Material costs by $3.50 per ton
These LCA metrics set the stage for examining how mix design choices influence long-term sustainability outcomes.
Also See: Importance Of Layering in Asphalt Durability
Key Factors in Asphalt Life Cycle Analysis
Life cycle assessment asphalt studies rely on three core elements: mix design precision, resource management, and cost tracking from production to recycling. These factors determine asphalt’s competitive edge against LCA alternative materials like concrete or composites.
Asphalt Mix Design Optimization
Modern mix designs blend aggregates, recycled asphalt pavement (RAP), and performance-graded (PG) binders to meet specific traffic loads. Engineers target 15-40% RAP integration while maintaining Marshall stability values above 8 kN. Warm mix asphalt additives cut production temps by 50°F, slashing energy use by 35% compared to traditional hot mix.
Balancing Performance and Environmental Impact
High-RAP mixes reduce virgin material demand but require polymer-modified binders to prevent cracking. A 2023 Federal Highway Administration study found mixes with 30% RAP and SBS polymers lowered global warming potential by 22% versus virgin asphalt. Cross-functional teams use Superpave software to model rut resistance and carbon output simultaneously.
Resource Efficiency in Asphalt Production
Asphalt plants now reclaim 95% of waste heat and reuse 99% of reclaimed materials. Drum mixers with parallel flow design achieve 8-12% fuel savings over batch plants. The National Asphalt Pavement Association reports 94% recycling rates for asphalt millings – 80% higher than concrete’s aggregate recovery rate. This circular approach conserves 60 million tons of aggregates annually in the US alone.
Cost-effectiveness Across Life Stages
While asphalt’s initial installation costs $2-$5 per square foot (20% less than concrete), its true value emerges during maintenance. Thin asphalt overlays at $1.50/sf restore surfaces for 7-10 years versus full-depth concrete replacement at $8-$12/sf. Life cycle cost analysis (LCCA) models show 40-year asphalt roads with recycling save $15-$25 per linear foot versus alternatives requiring complete reconstruction.
These efficiency gains set the stage for direct comparisons with emerging materials. Next, we’ll examine how asphalt stacks up against recycled plastics and bio-binders in real-world applications.
Comparing Asphalt With Alternative Road Materials
Road construction materials vary widely in environmental footprint and performance. Life cycle assessment (LCA) tools measure impacts from extraction to disposal, revealing key trade-offs between asphalt and substitutes.
Concrete Pavement: Durability Vs Emissions
Concrete roads last 30+ years but emit 1.35 tons of CO₂ per ton during production—27x higher than asphalt’s 0.05 tons. Though durable under heavy loads, concrete’s cement content drives 90% of its emissions. Energy use also climbs to 1.8 GJ/ton versus asphalt’s 1.2 GJ/ton. Maintenance needs differ: concrete requires joint repairs, while asphalt needs resurfacing every 12-20 years.
| Material | CO₂ Emissions (ton/ton) | Energy Use (GJ/ton) | Lifespan |
|---|---|---|---|
| Asphalt | 0.05 | 1.2 | 20 years |
| Concrete | 1.35 | 1.8 | 30+ years |
Recycled Plastic and Composite Materials
Plastic-modified roads blend 8-20% recycled polymers with asphalt. This cuts virgin bitumen use by 10% and lowers carbon footprints by 15%. Yet LCA studies flag risks: microplastic leaching increases water toxicity by 40% in lab tests. Composite roads also show rutting at 140°F, requiring additives that raise costs by $12-$18 per ton.
Bio-based Binders (E.g., Lignin)
Lignin, a byproduct of paper mills, replaces 30-50% of bitumen in eco asphalt mixes. Trials show 20-30% lower GHG emissions versus traditional asphalt. But bio-binders soften at 95°F, limiting use in hot climates. Durability tests report 15% higher cracking rates after freeze-thaw cycles compared to PG 64-22 binders.
Wood Plastic Composite Limitations
Wood-plastic composites (WPCs) merge sawdust with recycled plastics. While LCA scores favor WPCs on paper (1.1 tons CO₂ vs asphalt’s 1.4 tons), real-world performance falters. Moisture absorption causes 8-12% swelling, accelerating decay. Life cycle costs jump 40% due to frequent replacements—every 7-10 years versus asphalt’s 20-year cycle.
Each material’s strengths and weaknesses highlight why LCA asphalt alternatives require context-specific analysis. Next, we’ll break down the metrics shaping these environmental comparisons.
Environmental Impact Metrics for Asphalt
Quantifying impacts of asphalt roads involves tracking outputs from material sourcing to disposal. Three factors dominate discussions: carbon output, fuel consumption, and land-water interactions.
CO2 Output in Asphalt Production
Making 1 ton of hot mix asphalt releases ~40 kg of CO2. High temps (150-190°C) for heating aggregates and binders account for 85% of this output. Coal-fired plants in bitumen processing add 12% more. Comparatively, concrete pavements release 20% higher CO2 per ton but last longer. Using 30% RAP cuts asphalt’s carbon output by 18%, narrowing this gap.
Fuel Needs for Hot Mix Asphalt
Producing hot mix asphalt requires 280-320 MJ of fuel per ton. Diesel-powered machinery for mixing and laying adds 15-20 MJ/ton. Warm mix asphalt (WMA), made at 30°C lower temps, slashes fuel use by 35%. Though WMA adoption grew 42% from 2015-2022, its higher upfront cost limits market share to 28% of U.S. projects. Concrete roads need 50% more fuel during installation but require less upkeep.
Land Interactions and Water System Effects
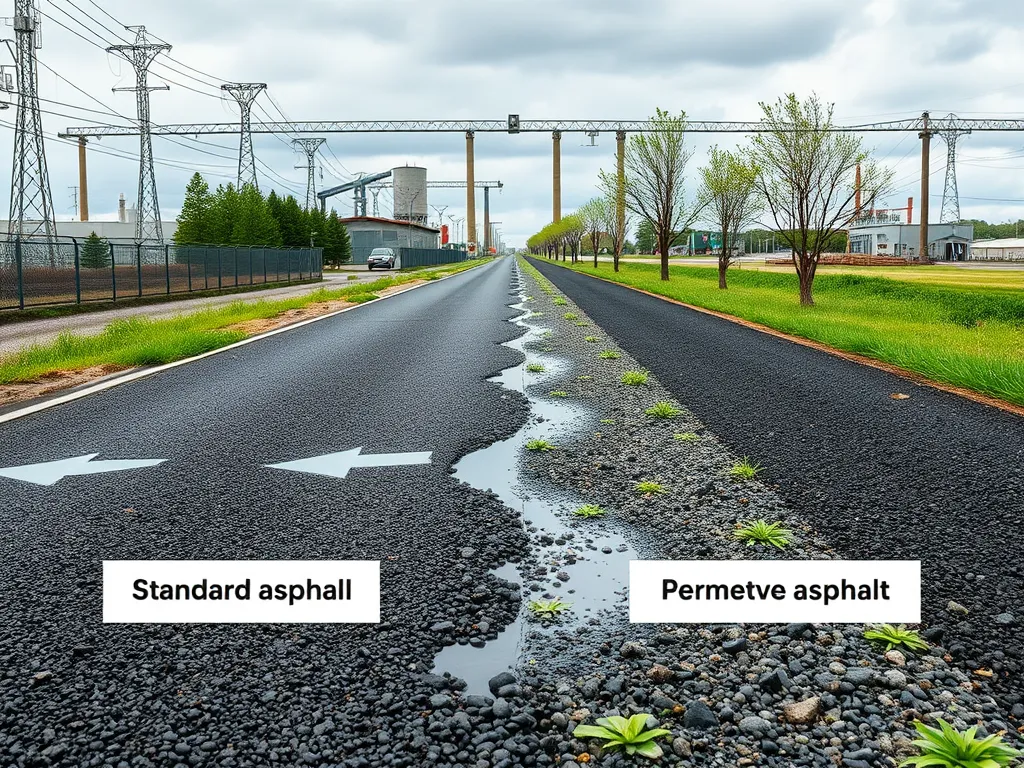
Aggregate quarries occupy 0.02 acres per 1,000 tons of material. Asphalt plants within 500 meters of water bodies raise runoff risks—1 ton of pavement can carry 6-8 grams of PAHs (polycyclic aromatic hydrocarbons) into watersheds. Permeable asphalt options cut runoff by 70%, but cost $18-$25 per sq yd versus $8-$12 for standard mixes. Landfill disposal of non-recycled asphalt claims 45 million cubic yards of U.S. landfill space annually.
Looking at impacts from start to finish shows how choices in road building affect surroundings. Next, factors in sourcing and moving materials come into play.
Four Critical Considerations in Asphalt LCA
Life cycle assessment of asphalt requires examining four core factors that shape its environmental footprint. These elements determine how asphalt stacks up against concrete, recycled plastics, or bio-based binders in eco-efficiency.
1. Material Sourcing and Transportation
Asphalt production starts with aggregates (crushed rock, sand) and bitumen – a petroleum byproduct. Transporting these materials accounts for 20-30% of total CO2 emissions in asphalt LCA. For example, hauling aggregates over 50 miles increases a project’s carbon footprint by 15% compared to local sourcing. Alternatives like concrete rely on cement, which emits 0.9 tons of CO2 per ton produced – 8x higher than bitumen refining.
2. Construction Techniques and Waste
Hot mix asphalt (HMA) requires heating to 300°F, consuming 25-35 gallons of fuel per ton. Warm mix asphalt (WMA) slashes temps to 220°F, cutting emissions by 20%. Construction waste varies sharply: asphalt generates 5% waste vs 12% for concrete. Over 95% of milled asphalt gets reused, while 40% of concrete demolition debris ends in landfills.
3. Long-term Maintenance Requirements
Asphalt roads need resealing every 3-5 years ($0.14-$0.25 per sq ft) but rarely require full-depth repairs. Concrete lasts 20-40 years but costs $2.50-$4.50 per sq ft for joint repairs or slab replacements. A 2023 FHWA study found asphalt’s 30-year maintenance emissions are 18% lower than concrete due to fewer heavy machinery interventions.
4. Recyclability and Circular Economy Potential
- Recycled Asphalt Pavement (RAP): Up to 40% RAP content in new mixes reduces virgin material needs by 1.2M tons annually
- Closed-loop systems: 80% of asphalt removed during repairs gets reprocessed – plastic composites manage only 22% reuse
- End-of-life scenarios: Asphalt’s 99% recyclability rate outperforms wood-plastic composites (35%) and bio-binders (60%)
These factors highlight why life cycle analysis asphalt versus alternative materials often favors asphalt in urban settings. Next, we’ll explore how digital tools like asphalt calculators optimize LCA planning through precise material tracking.
Role Of Asphalt Calculator in LCA Planning
Modern tools for asphalt quantity analysis shape how planners approach life cycle assessment. Asphalt Calculator USA’s digital platform provides data-driven insights into material needs, aiding comparisons with LCA alternative materials like concrete or bio-based binders.
Estimating Material Quantities for Projects
Accurate projections form the foundation of any LCA asphalt study. A 1-inch layer over 1,000 sq.ft. requires roughly 3.5 tons of hot mix asphalt (HMA). Input variables like thickness, project area, and RAP (Recycled Asphalt Pavement) percentages directly impact:
- Aggregate demand (crushed stone, sand)
- Bitumen binder volume (PG 64-22 or modified)
- Transportation fuel costs (average 15-20% of total CO2 in asphalt production)
With 95% of U.S. roads using asphalt, precise calculations prevent overordering. This lowers surplus material storage needs by up to 12% in large projects.
Reducing Waste Through Accurate Measurements
Construction waste contributes 23% of landfill mass nationwide. Digital asphalt calculators cut surplus by linking mix design specs to site-specific factors:
- Jobsite temperature adjustments for compaction
- Local aggregate absorption rates (0.5-2% variance)
- RAP integration limits (30-50% based on state DOT rules)
Projects using calculator-guided ordering report 18% less milled asphalt sent to landfills. Pairing this with warm-mix tech (250°F vs traditional 300°F) slashes plant fuel use by 20%.
With material flows mapped, the next phase examines how asphalt stacks up against LCA alternative materials in real-world conditions.
FAQ: Life Cycle Assessment Of Asphalt Vs Alternative Materials
What is a Life Cycle Assessment (LCA) and Why is It Important for Road Materials?
A Life Cycle Assessment (LCA) evaluates the environmental impacts of a product throughout its entire life cycle, from raw material extraction to disposal. For road materials, this is crucial as it helps stakeholders understand the cumulative effects on climate change, resource depletion, and ecosystem health, enabling informed decision-making for sustainable infrastructure projects.
How Does the LCA Of Asphalt Compare to That Of Alternative Materials?
The LCA of asphalt typically shows lower carbon emissions and resource usage compared to alternatives like concrete or recycled plastics. For instance, asphalt’s CO₂ emissions during production are significantly lower than those of concrete. Additionally, asphalt’s high recyclability rate enhances its sustainability profile, while alternative materials may have higher long-term environmental impacts due to durability and maintenance needs.
What Limitations Exist Within the Methodology Of Asphalt LCA?
One limitation of LCA methodologies is the variability in data quality and availability, which can influence results. Furthermore, LCA does not always account for all environmental impacts comprehensively, such as social and economic factors. Regional differences in production processes and environmental conditions can also result in varying results that may not apply universally.
Can the Choice Of Binder Affect Asphalt’s LCA Outcomes?
Yes, the choice of binder can significantly influence asphalt’s environmental impacts. For example, using polymer-modified binders may enhance performance and durability but can increase production emissions. On the other hand, bio-based binders might reduce carbon emissions but have limitations in performance under certain environmental conditions. Therefore, selecting the appropriate binder is essential for optimizing asphalt’s overall sustainability.
What Role Does Maintenance Play in the LCA Of Asphalt Versus Alternatives?
Maintenance substantially impacts the life cycle cost and environmental performance of asphalt and alternative materials. Asphalt typically requires more frequent resurfacing but has lower costs over its lifespan compared to alternatives that may last longer but incur higher repair costs. Effective maintenance strategies can enhance asphalt’s sustainability profile by extending its service life and reducing the need for complete reconstruction.
How Can Stakeholders Use LCA Findings in Decision-making?
Stakeholders can leverage LCA findings to make informed decisions about material selection, design approaches, and construction practices. This data helps identify areas for improvement in sustainability, cost management, and resource efficiency. By prioritizing materials with lower environmental impacts and higher recyclability, decision-makers can contribute to more sustainable infrastructure development.
What Future Trends Might Influence Asphalt’s LCA?
Future trends likely to influence asphalt’s LCA include advancements in recycling technologies, the development of more sustainable binder materials, and increasing regulatory pressures for reduced emissions. Additionally, the integration of digital tools and data analytics in construction practices will aid in optimizing asphalt mix designs and production methods toward greater sustainability.
Closing Thoughts
A comprehensive life cycle assessment (LCA) of asphalt versus alternative materials highlights the complexities and trade-offs involved in choosing road construction materials. Asphalt demonstrates strong performance in durability and cost-effectiveness. Its ability to be recycled also minimizes environmental impact over its life cycle.
Comparing asphalt with options like concrete, recycled plastics, and bio-based binders reveals varied strengths and weaknesses. Concrete may offer longevity but comes with higher emissions, while innovations in composites and bio-materials present new possibilities yet bring their own limitations.
Ultimately, the choice of material should consider not just immediate costs but long-term environmental metrics like carbon footprint, energy consumption, and recyclability. Adopting a holistic view will support sustainable infrastructure development.
For more insights and resources related to asphalt and construction materials, check out Asphalt Calculator USA.
Useful References for You:
- Huang, Y. H. (2004). Pavement Analysis and Design (2nd ed.). Upper Saddle River, NJ: Pearson/Prentice Hall.
- Life Cycle Assessment of Sustainable Asphalt Pavement Solutions Involving Recycled Aggregates and Polymers
- Life Cycle Assessment of Sustainable Asphalt Pavement Solutions Involving Recycled Aggregates and Polymers – PMC
- Energy and Environmental Life Cycle Assessment of Sustainable Pavement Materials and Technologies for Urban Roads
- A comparative life-cycle assessment of asphalt mixtures for railway sub-ballast containing alternative materials – ScienceDirect