Life Cycle Analysis Of Asphalt Products: Breaking Down Environmental Impact
Published on: March 8, 2026 | Last Updated: April 14, 2025
Written By: George Voss
Life cycle analysis (LCA) of asphalt products tracks their environmental footprint from material extraction to end-of-life recycling. This scientific method quantifies energy use, emissions, and costs across six phases: mining aggregates and bitumen, producing mixes like HMA (hot mix asphalt) and WMA (warm mix asphalt), transporting materials, paving roads, maintaining surfaces, and recycling RAP (recycled asphalt pavement). Compared to concrete, asphalt production uses 20% less energy and achieves a 95% recycling rate, diverting 60 million tons of waste annually in the U.S. LCAs reveal how material choices impact sustainability—like using RAP to lower costs by 25% and reduce CO₂ emissions by 1.5 tons per lane mile.
This article explains how asphalt LCAs work and why they matter. You’ll see how production temperatures affect emissions, compare asphalt’s 30-year carbon footprint to concrete, and learn recycling methods that reuse 90% of old pavement. We’ll cover industry standards like PG binder grades, analyze costs across pavement lifespans, and explore regulations shaping greener practices. Whether you’re a contractor or planner, these insights help make data-driven decisions for durable, eco-friendly roads.
Contents
- Understanding Life Cycle Analysis (LCA) in Asphalt Context
- Stages Of Asphalt Product Life Cycle
- Methodologies for Asphalt Life Cycle Assessment
- Comparative Analysis: Asphalt Vs. Concrete Pavements
- Carbon Footprint Of Asphalt Products
- Regulatory and Industry Standards for Asphalt LCA
- FAQs on Asphalt Life Cycle Analysis
- Closing Thoughts
- Useful References for You:
Understanding Life Cycle Analysis (LCA) in Asphalt Context
Life cycle analysis tracks asphalt from start to end. It shows how roads and pavements affect the planet at each step. This method helps builders cut waste, save cash, and meet green goals.
Definition and Purpose Of Asphalt LCA
Asphalt LCA maps each phase from rock and bitumen sourcing to road removal. It weighs energy use, air pollutants, and trash made. The goal? Find weak spots. Fix them. For example, swapping hot mix methods with warm mix tech can slash plant fuel use by 15-35%.
Relevance to Asphalt Product Sustainability
LCA proves asphalt’s green edge. Recycled Asphalt Pavement (RAP) cuts new bitumen use by 20-30% in mixes. Reusing old roads also trumps concrete’s higher CO2 output. Case: A 2022 study found roads with 40% RAP lowered emissions by 18% vs. virgin asphalt. Tools like PaLATE software now let teams pick eco-smart designs fast.
Next, we break down each stage of asphalt’s life—from quarry pits to pavement rehab.
Stages Of Asphalt Product Life Cycle
Breaking down the asphalt life cycle reveals key steps from start to end. Each stage affects cost, eco-footprint, and long-term value.
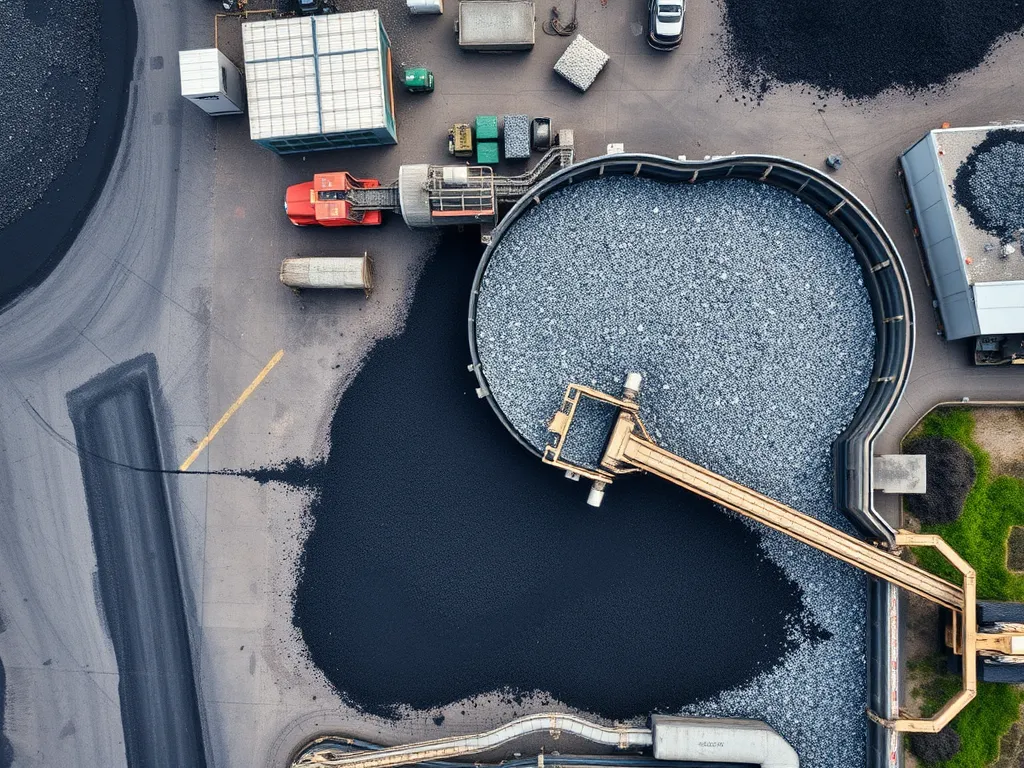
Raw Material Acquisition
Asphalt starts with two core parts: bitumen and aggregates. These shape its strength and green impact.
Sourcing Bitumen and Aggregates
Bitumen comes from crude oil refineries. Aggregates (crushed rock, sand) are mined from quarries. Local sourcing cuts transport miles. Over 90% of U.S. states use local rock sources for roads.
Environmental Impacts of Extraction
Mining rock uses heavy gear, burning 3-5 gallons of fuel per ton. Oil refining emits 0.5 tons of CO₂ per ton of bitumen. Water use hits 50 gallons per ton of mix during washing.
Production and Manufacturing
Turning raw parts into road mix needs heat, gear, and tech. Choices here set energy use and emissions.
Hot Mix Asphalt (HMA) Production
HMA cooks at 300°F, using 30-40 kWh per ton. Plants emit 20 lbs CO₂ per ton. New plants add baghouses to trap 95% of dust.
Warm Mix Asphalt (WMA) and Cold Mix Asphalt (CMA) Processes
WMA runs 50°F cooler, saving 15% fuel. CMA skips heat, using emulsifiers. WMA use grew 780% since 2009 in U.S. road jobs.
Transportation and Distribution
Moving asphalt eats fuel and time. Smart plans curb costs and fumes.
Logistics of Asphalt Delivery
Trucking 1 ton of mix 50 miles emits 12 lbs CO₂. Rail cuts this by 60%. Just-in-time loads keep trucks full, slashing trips.
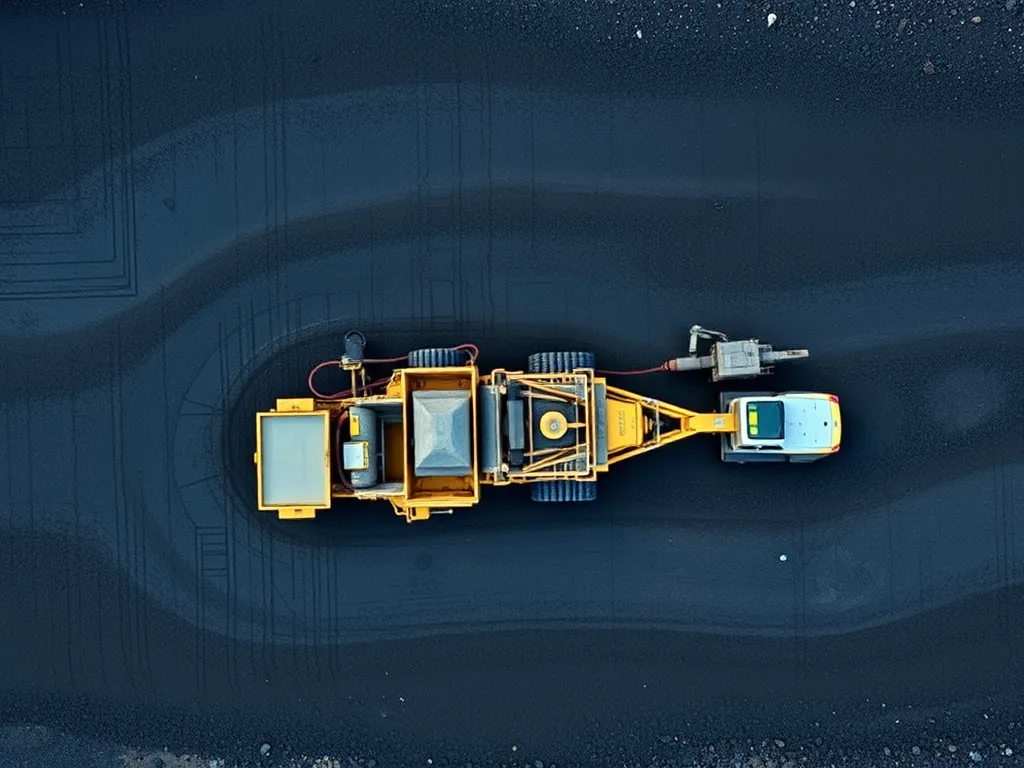
Construction and Installation
Paving decides road life and upkeep needs. Gear choice and crew skill matter.
Paving Techniques and Energy Use
Rollers use 8-10 gallons of fuel per hour. Laser-guided pavers trim waste by 7%. Night work in cities can cut traffic delays by 30%.
Use, Maintenance, and Rehabilitation
Good roads last 20 years with care. Fixes beat full rebuilds for cost and carbon.
Long-Term Durability and Repair Strategies
Crack seals cost $0.50 per foot vs. $15 per foot for new lanes. Thin overlays every 10 years add 15 years to road life. High-PG binders curb rutting in hot zones.
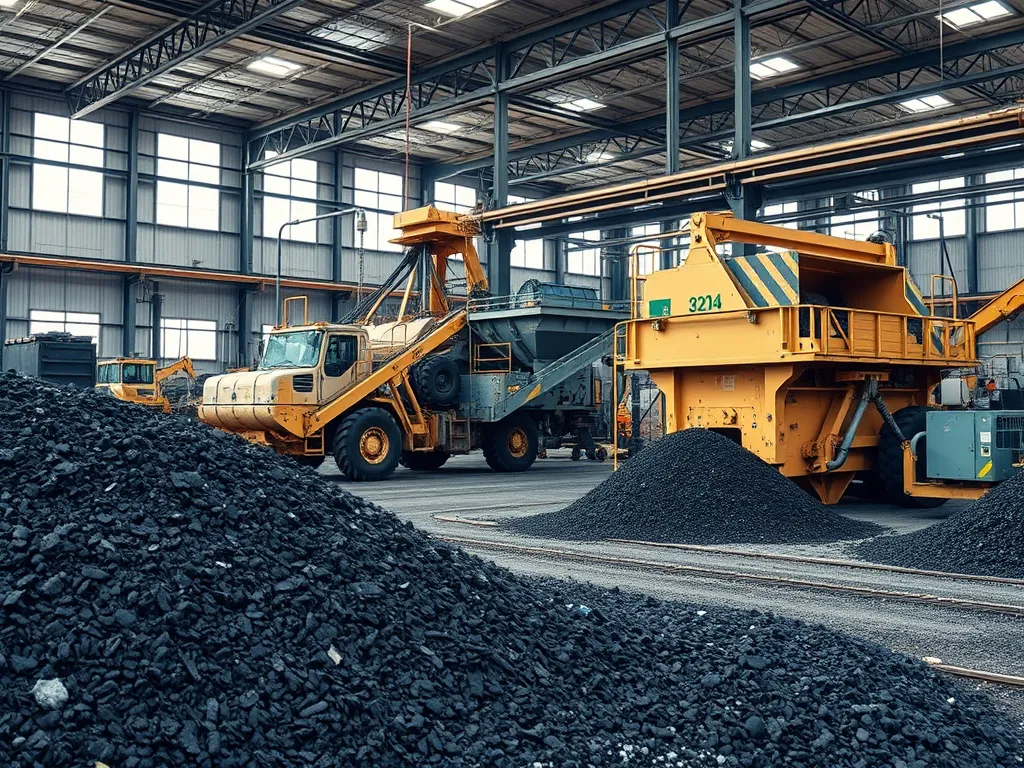
End-of-life Management
Old roads don’t die—they get reborn. Recycling beats dumping in cost and carbon.
Recycling Asphalt (RAP) and Disposal Methods
RAP reuse hits 99% in some states. Adding 20% RAP cuts new bitumen needs by 20%. Landfill fees run $30 per ton—twice the cost of milling.
Next, we’ll break down how experts track these steps in formal life cycle checks.
Methodologies for Asphalt Life Cycle Assessment
Life cycle assessment (LCA) tools measure asphalt’s eco-impact from start to end. Two main methods shape these studies, each with distinct scope and use cases.
Cradle-to-gate Vs. Cradle-to-grave Approaches
Cradle-to-gate tracks impacts from raw material pull to plant output. It stops once asphalt leaves the mix plant. Data covers mining, processing, and plant energy. This method suits suppliers aiming to cut plant-level footprints.
| Approach | Scope | Use Case |
|---|---|---|
| Cradle-to-Gate | Extraction to plant exit | Mix design choices |
| Cradle-to-Grave | Extraction to disposal/recycle | Full road life impacts |
Cradle-to-grave adds paving, road use, upkeep, and end-of-life. It counts fuel for trucks, road wear, and RAP reuse. DOTs use this for road project bids.
Key Metrics in Asphalt LCA: Energy Use and Emissions
LCAs focus on two core data points: energy (MJ/ton) and CO2-eq (kg/ton). Hot mix asphalt (HMA) needs 300-400 MJ per ton. Warm mix tech cuts this by 20-35% via lower heat.
Emissions link to fuel type and temps. HMA emits 40-60 kg CO2 per ton. Key gases tracked:
- CO2 (burning fuels)
- NOx (plant heaters)
- PM2.5 (drum dryers)
New plants with RAP gear hit 95% recycled rates. Each 10% RAP use drops emissions by 5-7%.
Next, we’ll compare asphalt and concrete using these metrics in real-world settings.
Also See: Cost Effectiveness Of Sealcoating: Is It Worth It?
Comparative Analysis: Asphalt Vs. Concrete Pavements
Choosing between asphalt and concrete roads? Life cycle data shows key trade-offs in eco-impact and long-term costs.
Lifecycle Environmental Impact Comparison
Asphalt emits 10-15% less CO2 per ton than concrete during production. Why? Lower heat needs (280-320°F for warm mix vs. 1,450°F for cement). Both materials use rock and sand, but asphalt recycles better – 99% gets reused vs. 35% for concrete. Still, concrete lasts 25-40 years vs. asphalt’s 15-20 years, cutting rebuild needs.
| Factor | Asphalt | Concrete |
|---|---|---|
| CO2 per ton (production) | 35 kg | 42 kg |
| Energy use (MJ/ton) | 180 | 290 |
| Recycle rate | 99% | 35% |
Cost Efficiency Over Operational Lifespan
Asphalt costs $2-$5 per sq.ft. to install – half of concrete’s $4-$8 range. But upkeep varies: asphalt needs seal coats every 3-5 years ($0.15-$0.25/sq.ft.), while concrete cracks less but costs 40% more to fix. Over 30 years, recycled asphalt cuts total spend by 20-30% vs. new mixes.
| Cost Factor | Asphalt | Concrete |
|---|---|---|
| Install ($/sq.ft.) | 2-5 | 4-8 |
| Repair cycle | 8-12 years | 15-25 years |
| 30-year cost (with recycling) | $12-$18 | $20-$30 |
These numbers set the stage to explore asphalt’s carbon footprint – from mix plants to reuse.
Carbon Footprint Of Asphalt Products
Measuring the carbon footprint of asphalt requires tracking greenhouse gas (GHG) emissions across its entire life cycle. From material extraction to end-of-life recycling, each phase contributes distinct environmental impacts quantified in CO2 equivalents. This analysis drives sustainable decision-making in road construction.
Major Contributors to Greenhouse Gas Emissions
Asphalt production accounts for 80-90% of total emissions in its life cycle. Heating aggregates and bitumen to 275-325°F in Hot Mix Asphalt (HMA) plants burns fossil fuels, releasing 35-45 kg CO2 per ton. Bitumen refining adds 10-15 kg CO2 per ton due to energy-intensive distillation. Transporting raw materials 50-100 miles by diesel trucks emits 5-8 kg CO2 per ton-mile. Land use changes from aggregate mining and bitumen extraction further degrade carbon sinks.
| Stage | Key Activities | CO2 Contribution |
|---|---|---|
| Production | HMA heating, binder refining | 85% |
| Transport | Material hauling, paving equipment | 8% |
| Maintenance | Resurfacing, patching | 5% |
| End-of-Life | Landfilling vs. recycling | 2% |
Mitigation Strategies in Production and Recycling
Recycling Reclaimed Asphalt Pavement (RAP) cuts emissions by 25-35%. Reusing 95% RAP in new mixes reduces virgin bitumen demand. Warm Mix Asphalt (WMA) technologies lower production temps to 230-280°F, slashing fuel use by 20-40%. Bio-based binders derived from lignin or algae lower carbon intensity by 50% compared to petroleum bitumen. Local material sourcing within 30-mile radii minimizes transport emissions.
- Carbon Capture: Blue Aggregate treatments sequester 5-7% of CO2 during mixing
- Renewable Energy: Solar-powered plants reduce grid reliance
- Porous Pavements: Improve stormwater management, lowering urban heat island effects
Adopting these strategies can reduce asphalt’s carbon footprint by 40-60% per lane-mile. Up next: How regulatory standards enforce these practices industry-wide.
Regulatory and Industry Standards for Asphalt LCA
Rules and checks shape how asphalt makers track green impacts. Firms must align with laws to cut harm from roads.
Compliance With Environmental Regulations
The EPA sets air rules for asphalt plants under the Clean Air Act. Plants track fumes, dust, and CO2. Limits on PM2.5 (tiny particles) aim to guard lung health. States like Texas and California enforce strict NOx caps (nitrogen oxides) in mix plants. Using RAP (recycled asphalt) helps meet waste laws. Federal rules now push for 95% reuse of old roads. New tech like warm mix cuts plant heat needs by 20%, slashing CO2.
Role Of Sustainability Certifications
Greenroads and Envision scores reward green asphalt work. These checks look at full life cycles. To earn points, firms must show low energy use, high RAP rates, and clean truck fleets. LEED credits boost sites using 30%+ recycled asphalt. The Asphalt Institute’s Emerald Eco Label tracks CO2 per ton made. Certified plants often see 15-30% lower energy bills. Third-party audits check data in LCA reports for truth.
With rules and seals shaping the field, many ask how these steps fit into daily road work. Next, we’ll break down key queries on asphalt life cycles.
FAQs on Asphalt Life Cycle Analysis
What Are the 5 Stages Of a Life Cycle Analysis?
The five stages of a life cycle analysis are: 1) Raw Material Acquisition, 2) Production and Manufacturing, 3) Transportation and Distribution, 4) Construction and Installation, and 5) End-of-Life Management. Each stage assesses the environmental impact of asphalt products from their inception to their disposal or recycling.
What Defines the Life Cycle Of Asphalt Pavement?
The life cycle of asphalt pavement encompasses all phases, including the extraction of raw materials, the production process, usage and maintenance during its lifespan, and the final disposal or recycling at the end of its service life. Understanding this life cycle helps in assessing the overall environmental effects of asphalt pavements.
How Does Pavement LCA Differ From Product LCA?
Pavement LCA specifically focuses on the environmental impact of pavement systems throughout their life cycle, which includes all activities from material sourcing to maintenance and end-of-life disposal. In contrast, a general product LCA may cover a broader range of products and supply chains, including different materials used in various applications.
Why is LCA Critical for Asphalt Industry Practices?
LCA is critical for the asphalt industry as it provides a comprehensive evaluation of the environmental impacts associated with asphalt production and use. This analysis promotes informed decision-making, inspires the development of sustainable practices, and helps meet regulatory requirements, ultimately leading to reduced carbon footprints and improved sustainability outcomes.
Closing Thoughts
Life cycle analysis of asphalt products is a vital tool for promoting sustainability in the construction industry. By evaluating each stage—from raw material extraction to end-of-life management—we gain insights into the environmental impacts and potential savings associated with asphalt usage. Understanding energy consumption, emissions, and recycling options allows stakeholders to make informed decisions that benefit both the economy and the environment.
As the industry pushes for greener practices, asphalt’s role cannot be overlooked. Innovations in production methods like Warm Mix Asphalt and recycling technologies highlight its adaptability and long-term viability. Continuous assessment of asphalt products not only promotes compliance with regulations but also supports the move towards sustainable construction.
For more information on asphalt life cycle analysis and related resources, be sure to visit Asphalt Calculator USA.